
#173 Supplemental
It seems that all that was good has died and is decaying in me...

This post contains the key technical data and metrics used to create the weekly update released each Monday morning in Zen Trades.
1. Total Market Weekly Structure
No New Changes - Most Recent Update Nov 9, 2025:
(Chart: Link)
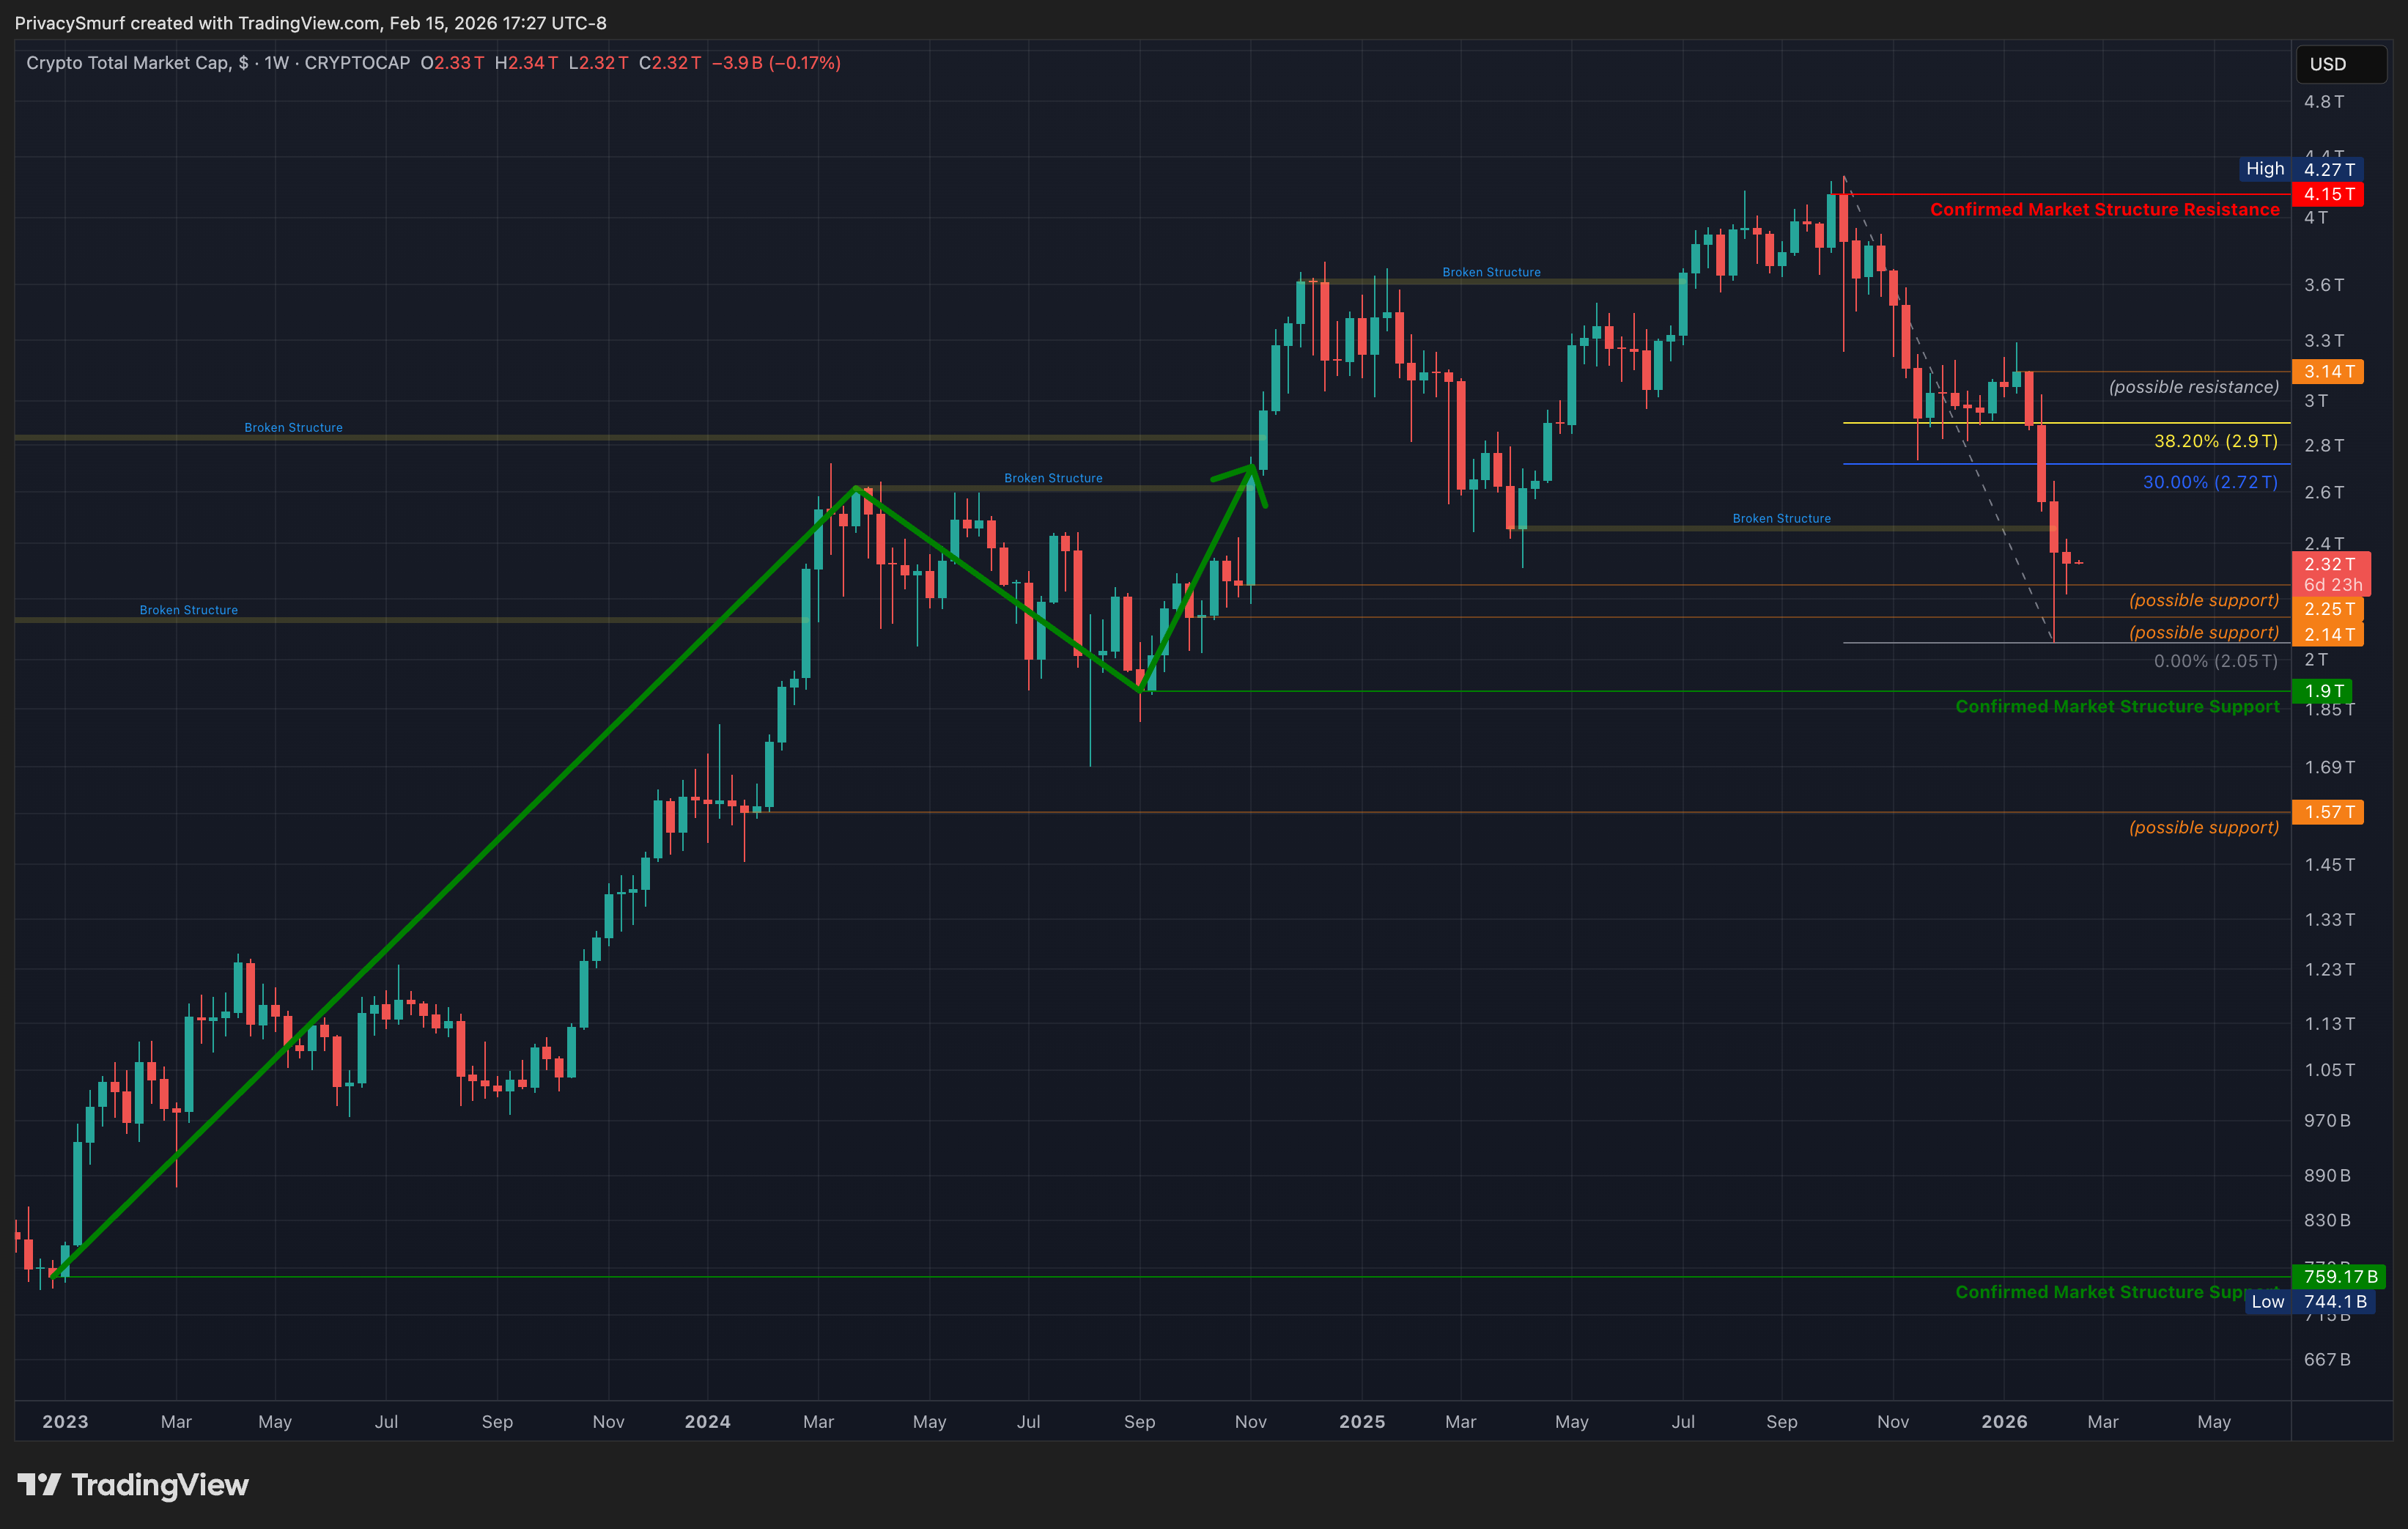
Trend: Neutral, bullish support broken. On retracement from the latest ATH.
Key Levels: Potential resistance at $3.14T. Resistance at $4.15T. Potential support at $2.25T & $2.14T. Support at $1.9T.
Confirmation Watch: Awaiting two consecutive bullish candles and a close above $2.9T (at the time of writing) to confirm support.
Potential Scenarios:
Bullish: Invalidated with the close below $2.46T. Must wait for more weekly structure to build out over time. We are now in a neutral market structure.
Traditional Bearish: A close below 2.14T would qualify as a shift to bearishness by my rules (one broken support and 2 broken potential supports). Or more traditionally, two bullish weeks and a rally above $2.9T would give us structure support at the lowest close. Breaking below that support after confirmation would flip the weekly trend to bearish, as it would create the traditional high, low, lower high, lower low zigzag shape.
2. Total Market Daily Structure
No new changes - Most Recent Update Nov 4, 2025:
(Chart: Link)
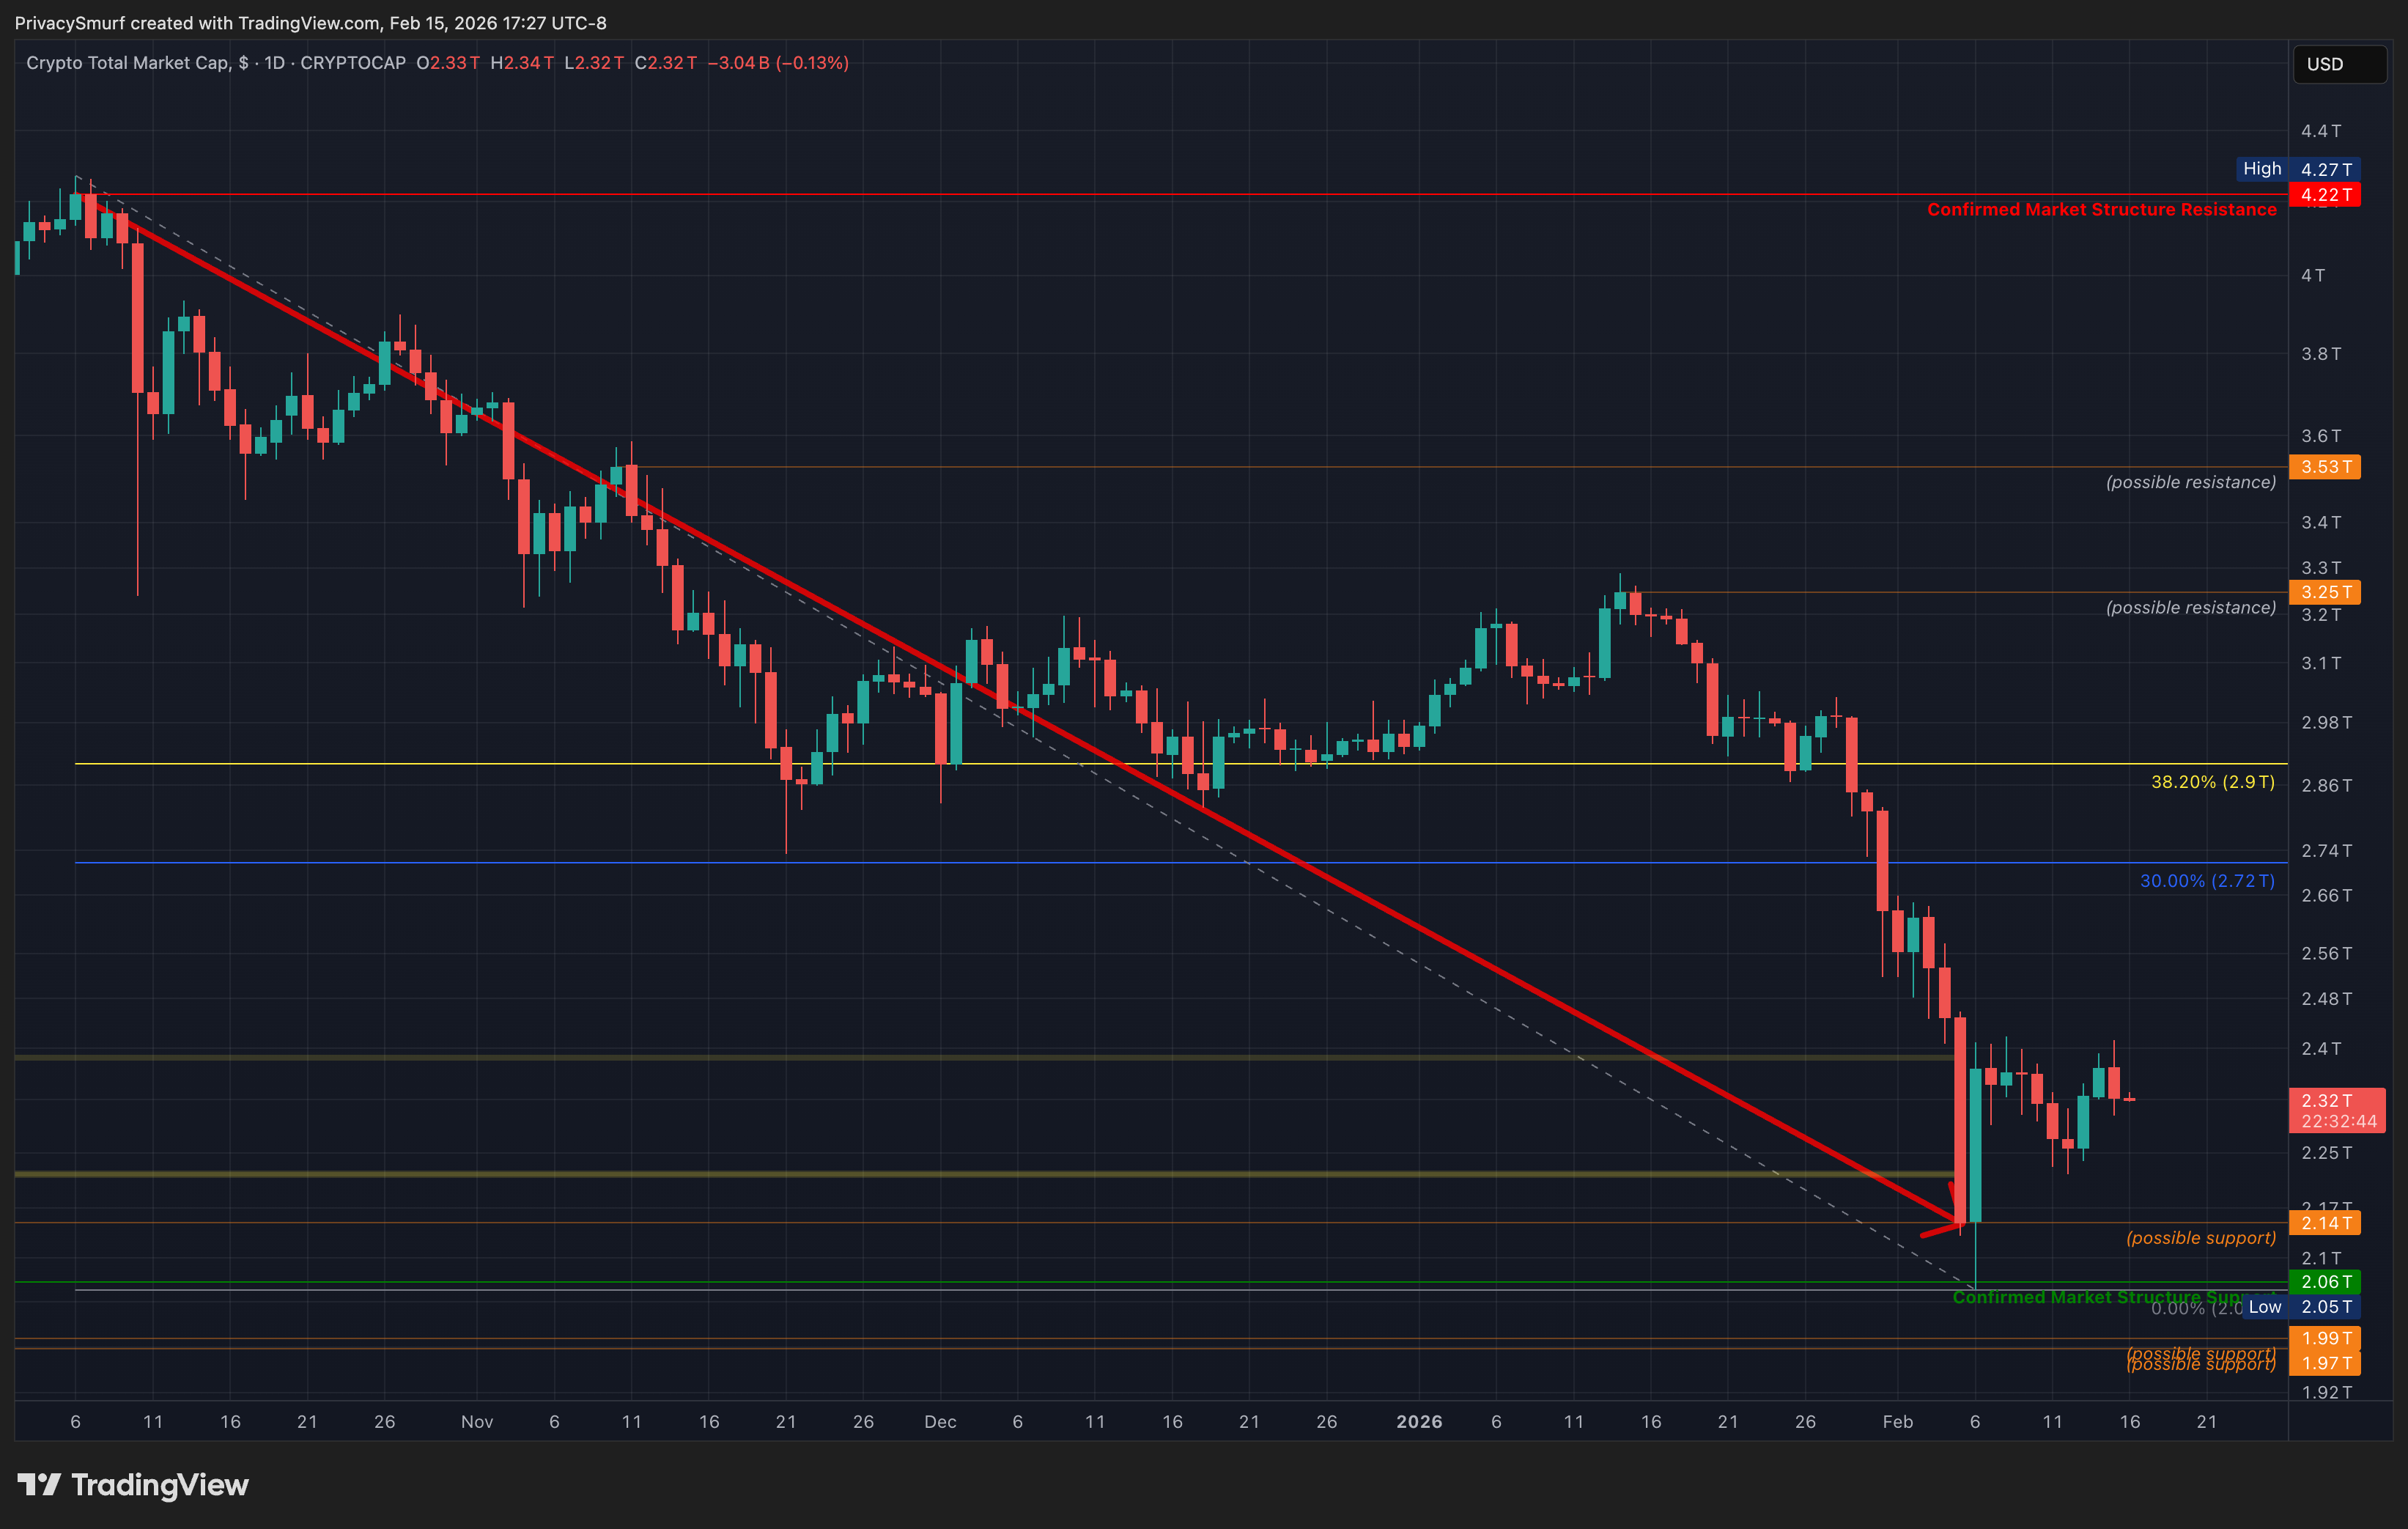
Trend: Bearish. On retracement from the latest ATH.
Key Levels: Potential resistance at $3.25T & $3.53T, Resistance at $4.22T. Potential support at $2.14T. Support at $2.06T.
Confirmation Watch: Awaiting a close above $2.9T (at the time of writing) to confirm support.
Potential Scenarios:
Bullish: Invalidated with the close below $2.39T. We have to wait for the price action to play out over a longer period.
Bearish: Structural trend confirmed bearish after breaking the $2.39T and $2.21T supports.
3. Crypto Money Flow
New Changes!! - Most Recent Update Feb 6, 2026:
(Chart: Link)
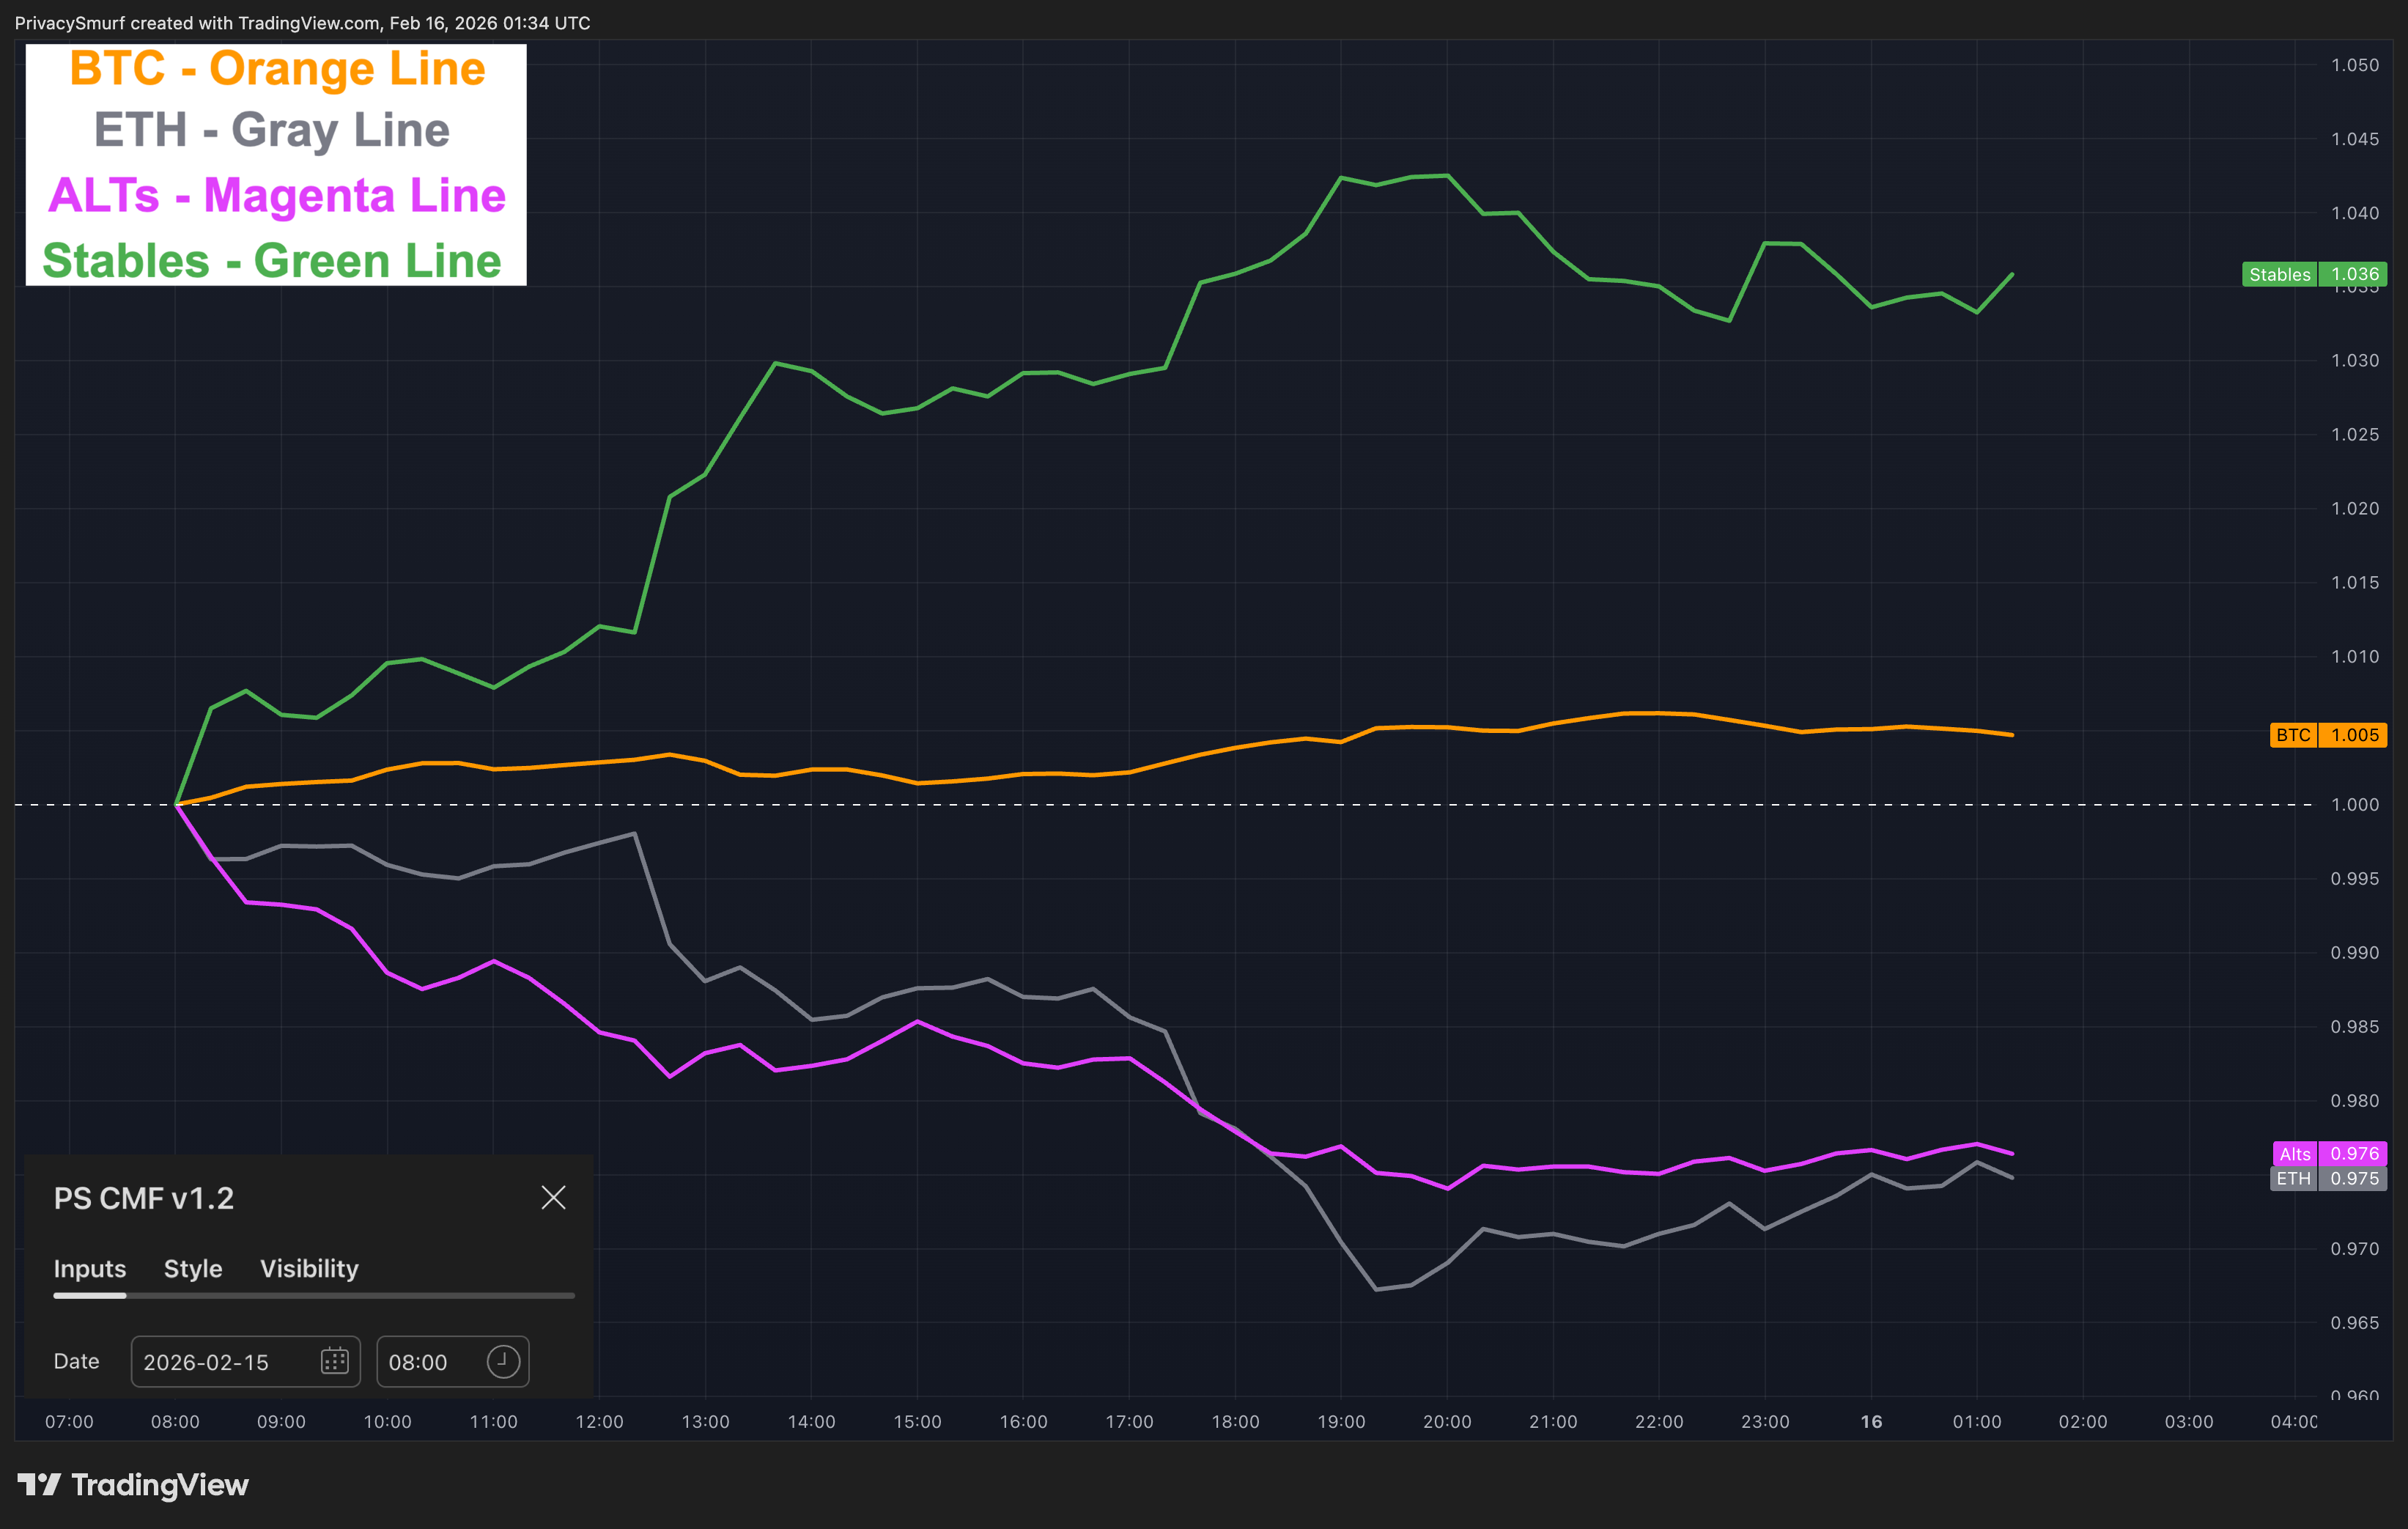
Anchor point: Feb 15, 2026, 00:00 UTC.
Observation: There was a full rotation prior to this post but it was pretty murky to define so I’m just going to move the anchor point forwards and leave things at that.
Interpretation: The market is still forming a bottom. We still need to see Stables fall and BTC to continue to increase, otherwise moves are just protective and the market will continue lower.
4. Additional Metrics
Retail Sentiment:
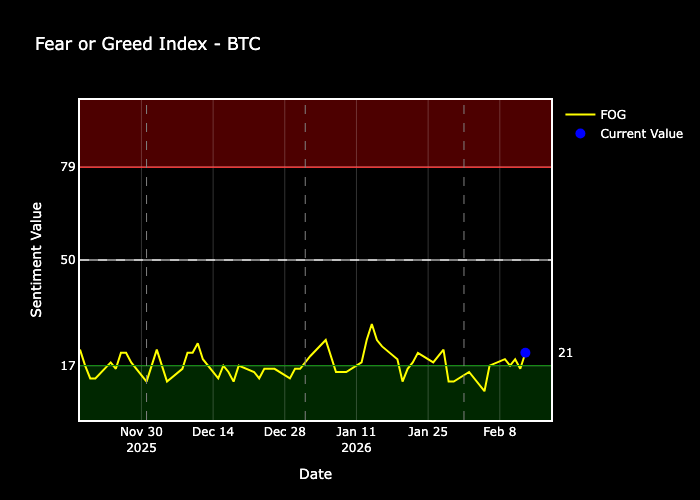
Highly Fearful. Market participants are super nervous. Despite the declining price action, we should still be on the lookout for a bullish signal to buy this fear for a turnaround. Patience is key to not being underwater.
Market Validity Score:
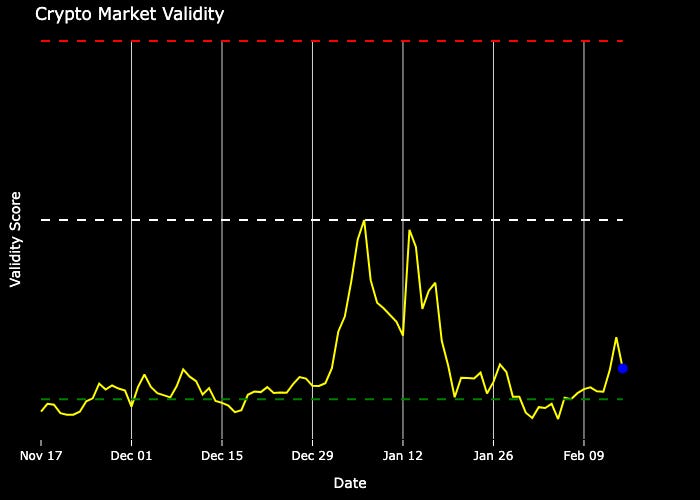
The majority of assets show bearish structure. Now we wait. DCAs should be paused for now.
Market Drivers:
The Market Driver Ratio measures relative performance concentration among the top 100 cryptocurrencies by comparing market-cap-weighted performance with equally weighted performance.
Rising ratio: Indicates a concentrated, large-cap dominated market. This typically reflects risk-off sentiment or Bitcoin/Ethereum leadership. Consider favoring large-cap positions or reducing altcoin exposure.
Falling ratio: Signals broad-based strength and altcoin outperformance. This reflects risk-on sentiment and market expansion. Consider rotating into smaller-cap opportunities.
Watch for turning points or ranges where the ratio changes overall direction or breaks levels. These often indicate shifts in market regime and can signal when to reposition between large-cap and altcoin strategies.
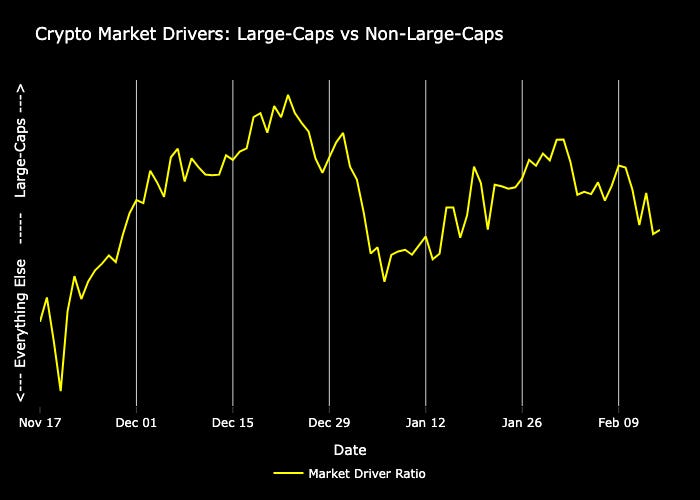
With the chart starting to move to the bottom of the recent range. It’s at a point of high risk and high reward for ALT breakouts. Continued breakdown is good for ALT trades.
Click the links below if you need a refresher on the sections above:
@ThePrivacySmurf