
CC #177: Failed Breakout Again
This time with some worse technicals and timing.

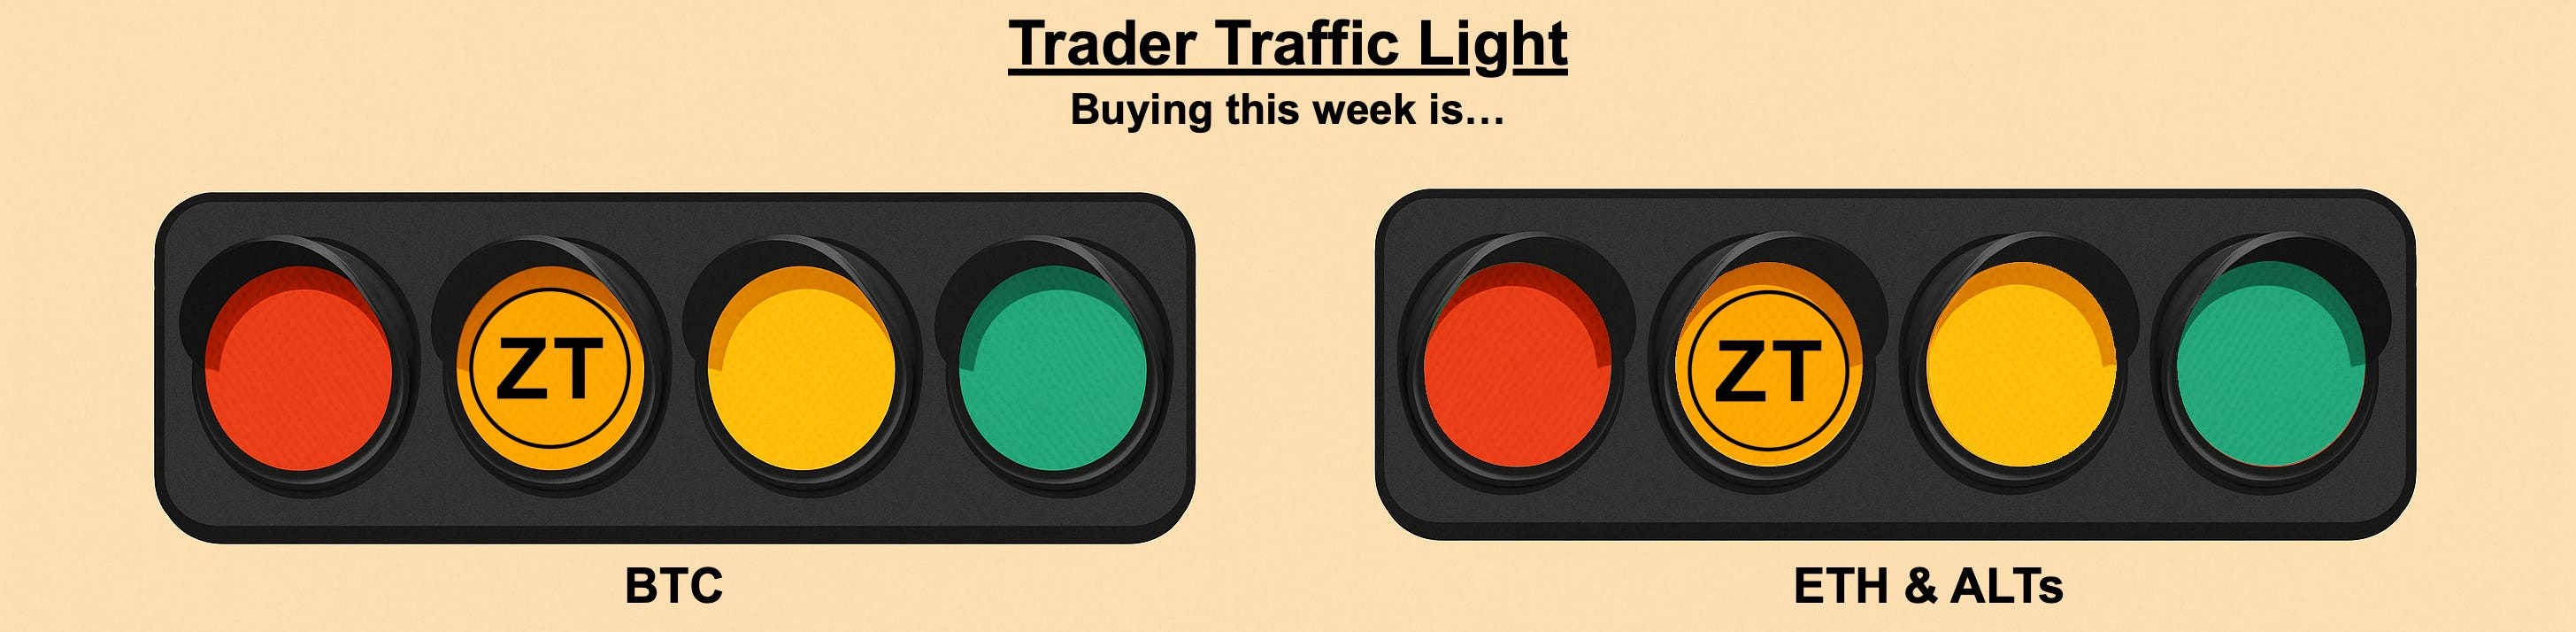
📝 Smurf’s Cheat Sheet
Range high breakout failed.
Momentum is fading towards bearishness.
The market is heavily allocating to Stables.
Sitting on hands, watching for a potential floor test or 79K breakout.
Current Bullish Positioning:
No BTC spot exposure.
No BTC leveraged exposure.
No leveraged ALT exposure at the moment. Took a few short-term breakouts this past week.
Overall Risk Posture:
Waiting to deploy.
1. Market Structure
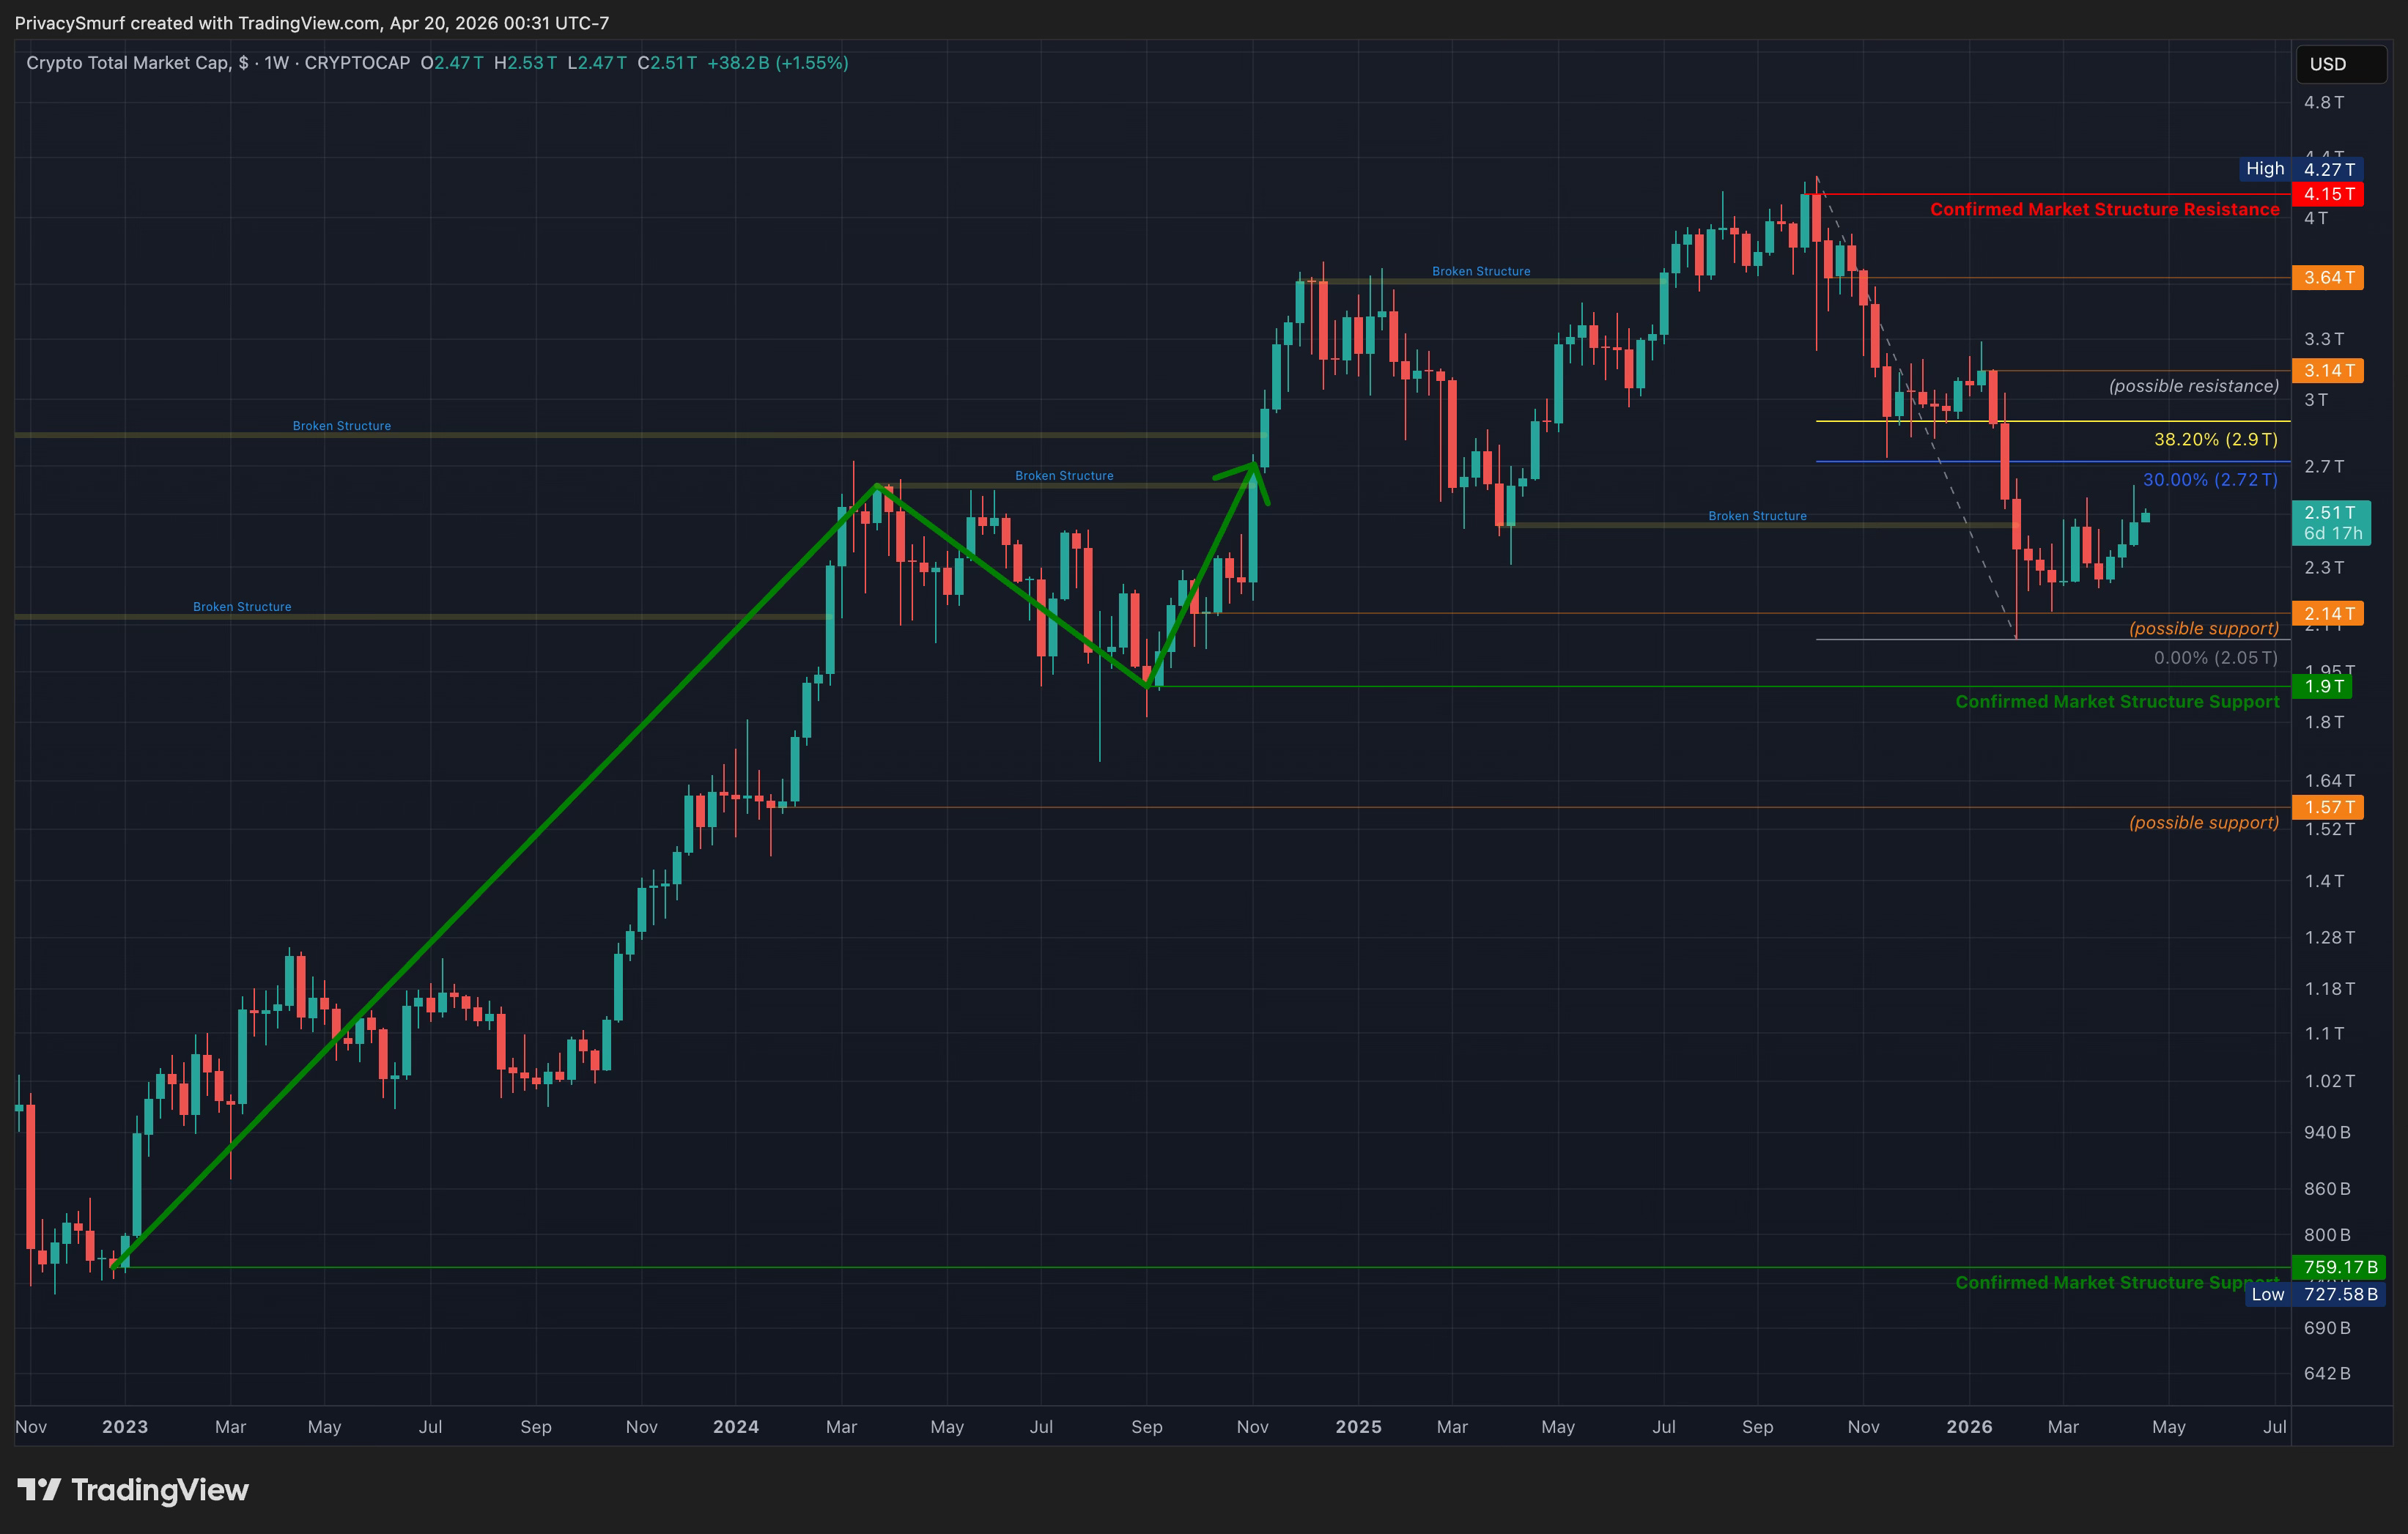
Weekly Trend: Neutral, since $2.46T support was broken
.
Resistance: Potential $3.14T, Confirmed $4.15T
Support: Confirmed $1.9T, Potential $2.14T
Bear Trend confirmation: close above $2.9T followed by close below $2.25T.
Daily Trend: Bearish, confirmed on $2.39T and $2.21T break.
Resistance: Potential $3.25T, $3.53T. Confirmed $4.22T
Support: Confirmed $2.06T. Potential $2.14T
Bull Trend watch: requires close above $2.9T
2. BTC — Full Technical Breakdown
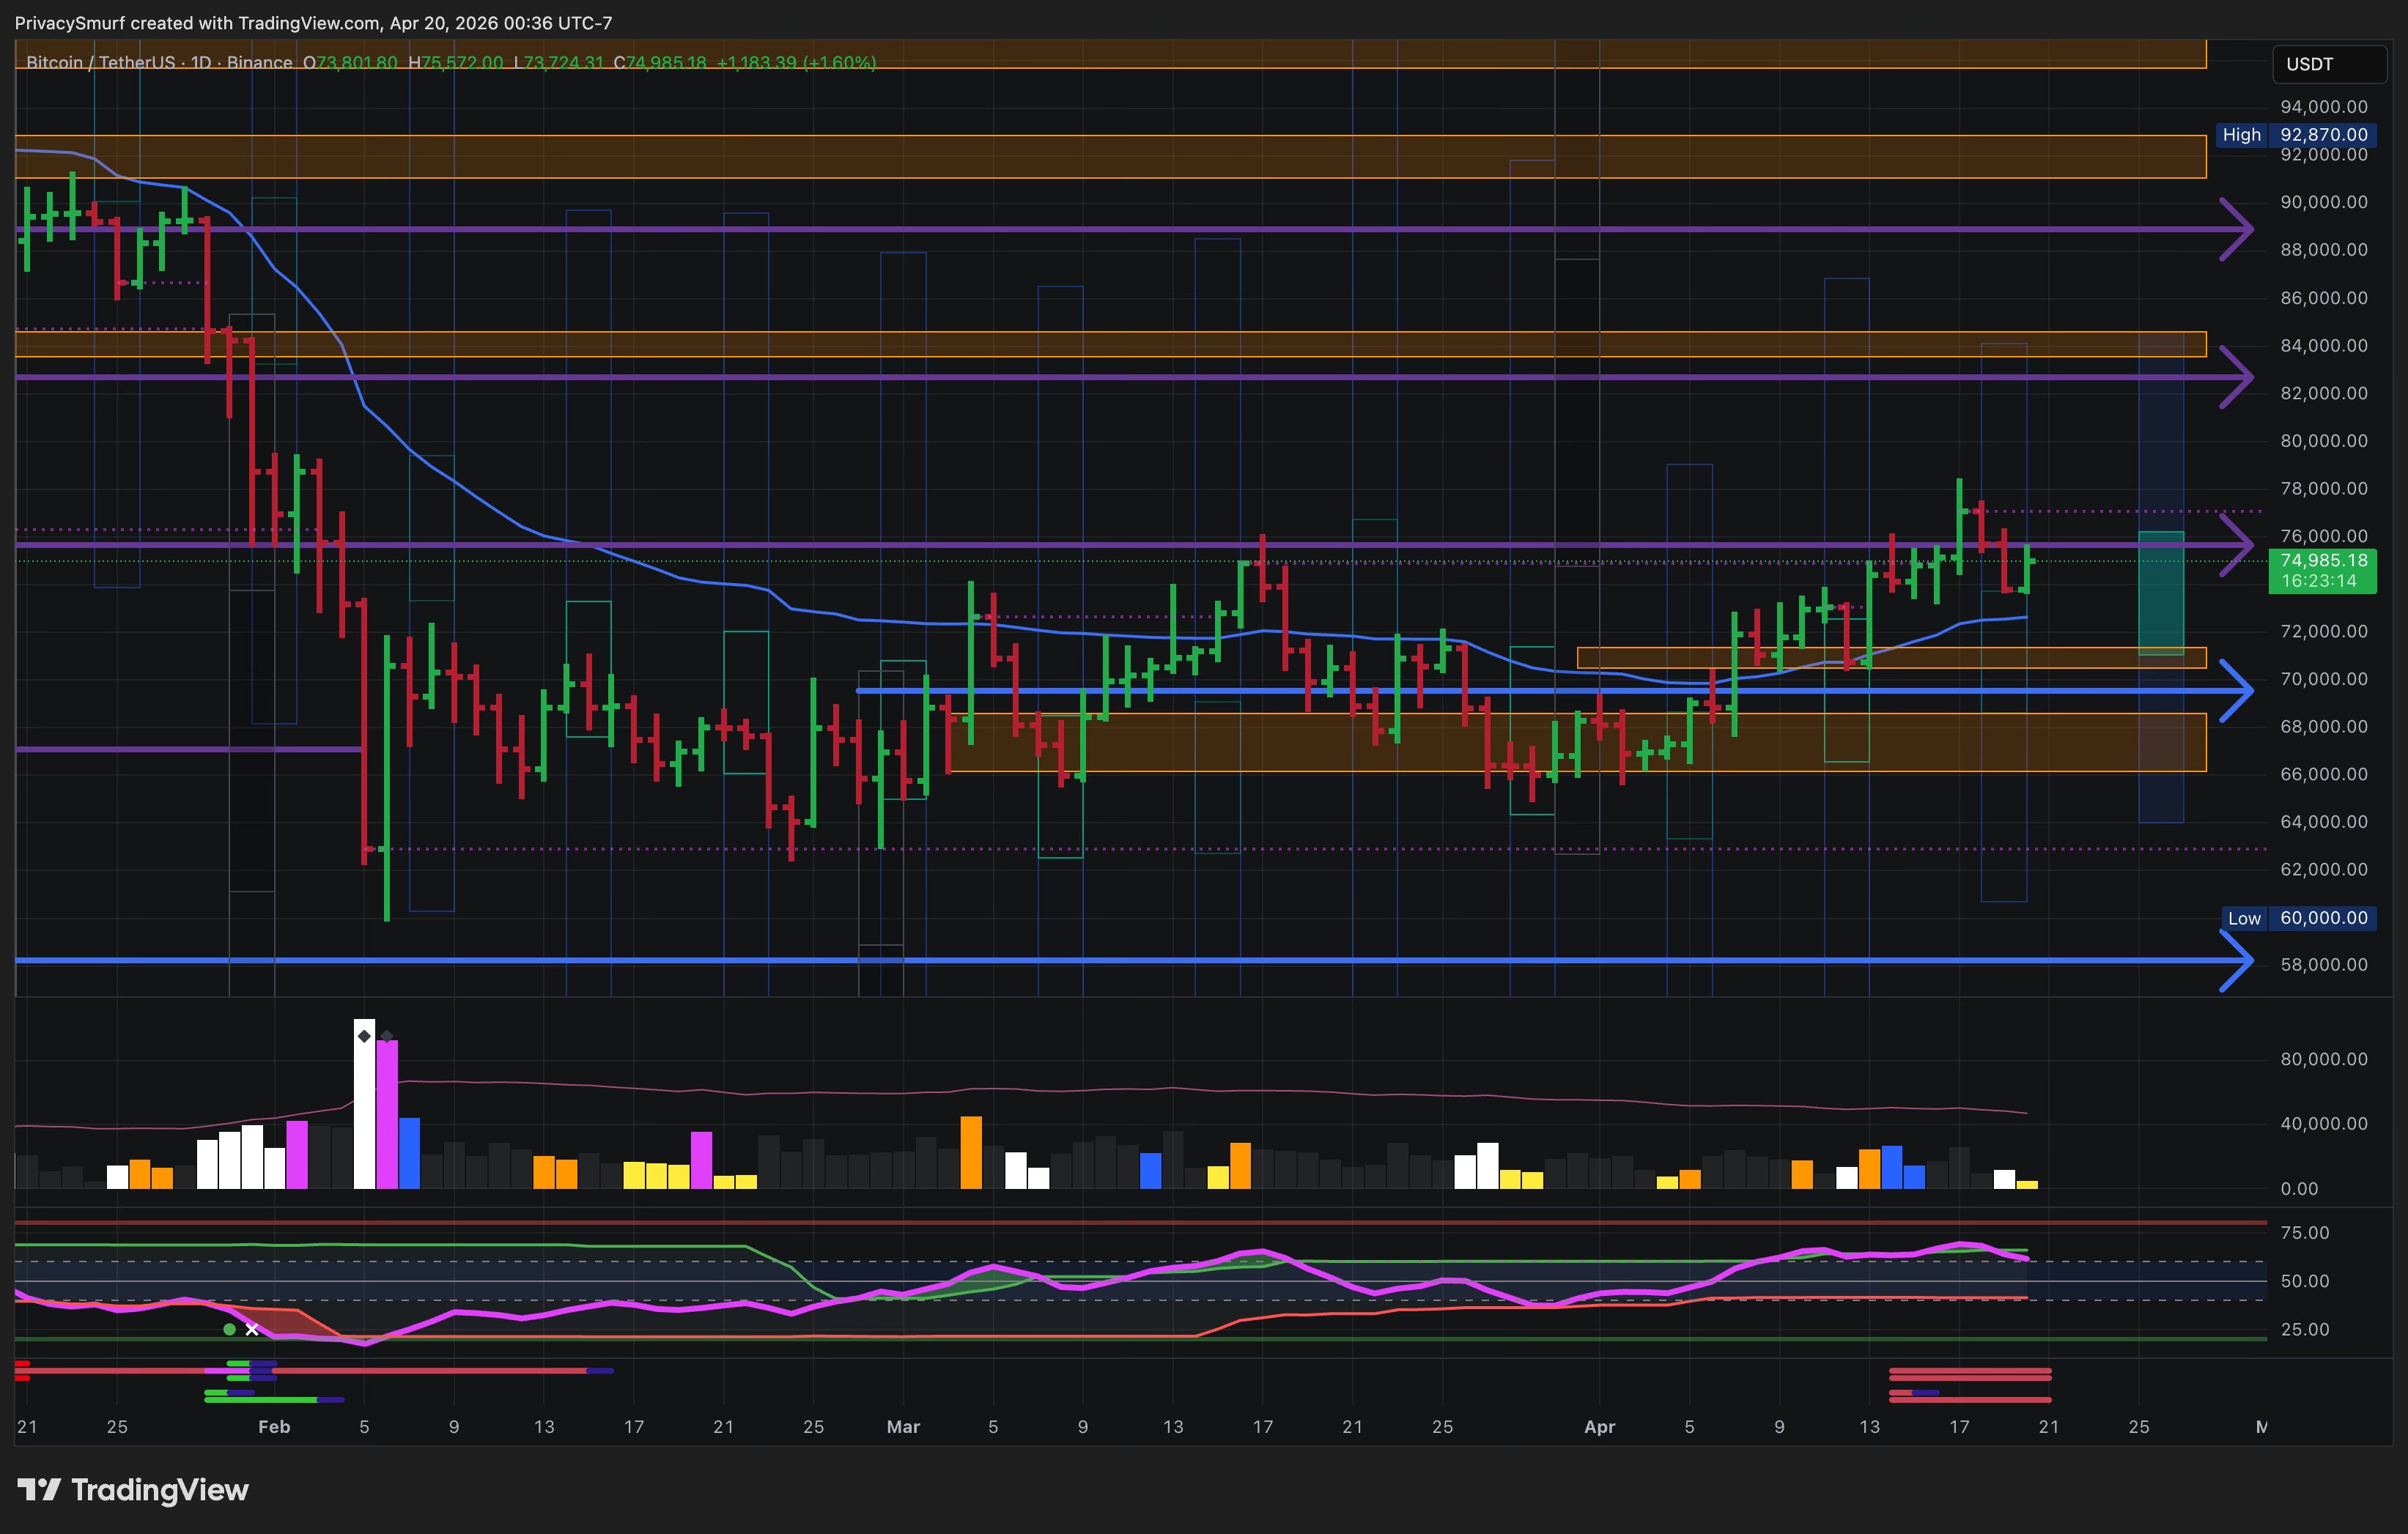
Weekly Closing Direction: Bearish (11 of 27 efficiency — 40.7% efficiency)
Weekly Closing Price Range: $64.3K–$71.4K (34 of 75 — 45.3% efficiency)
Price Action: Neutral Consolidation
Key Levels:
Resistance: $75.7K.
Support: $69.6K
RSI:
Above midline — momentum provides bullish influence on price
Closed back below the adaptive top band — impulsive bullish phase over Break out ceiling established at $77.1K
Watch for the bottom band break, which signals the start of an impulsive bearish phase.
Divergence Signals: None at the moment, but a bearish setup has appeared on multiple oscillators, pending trigger.
Past Divergence Trades:

3. ETH — Technical Breakdown
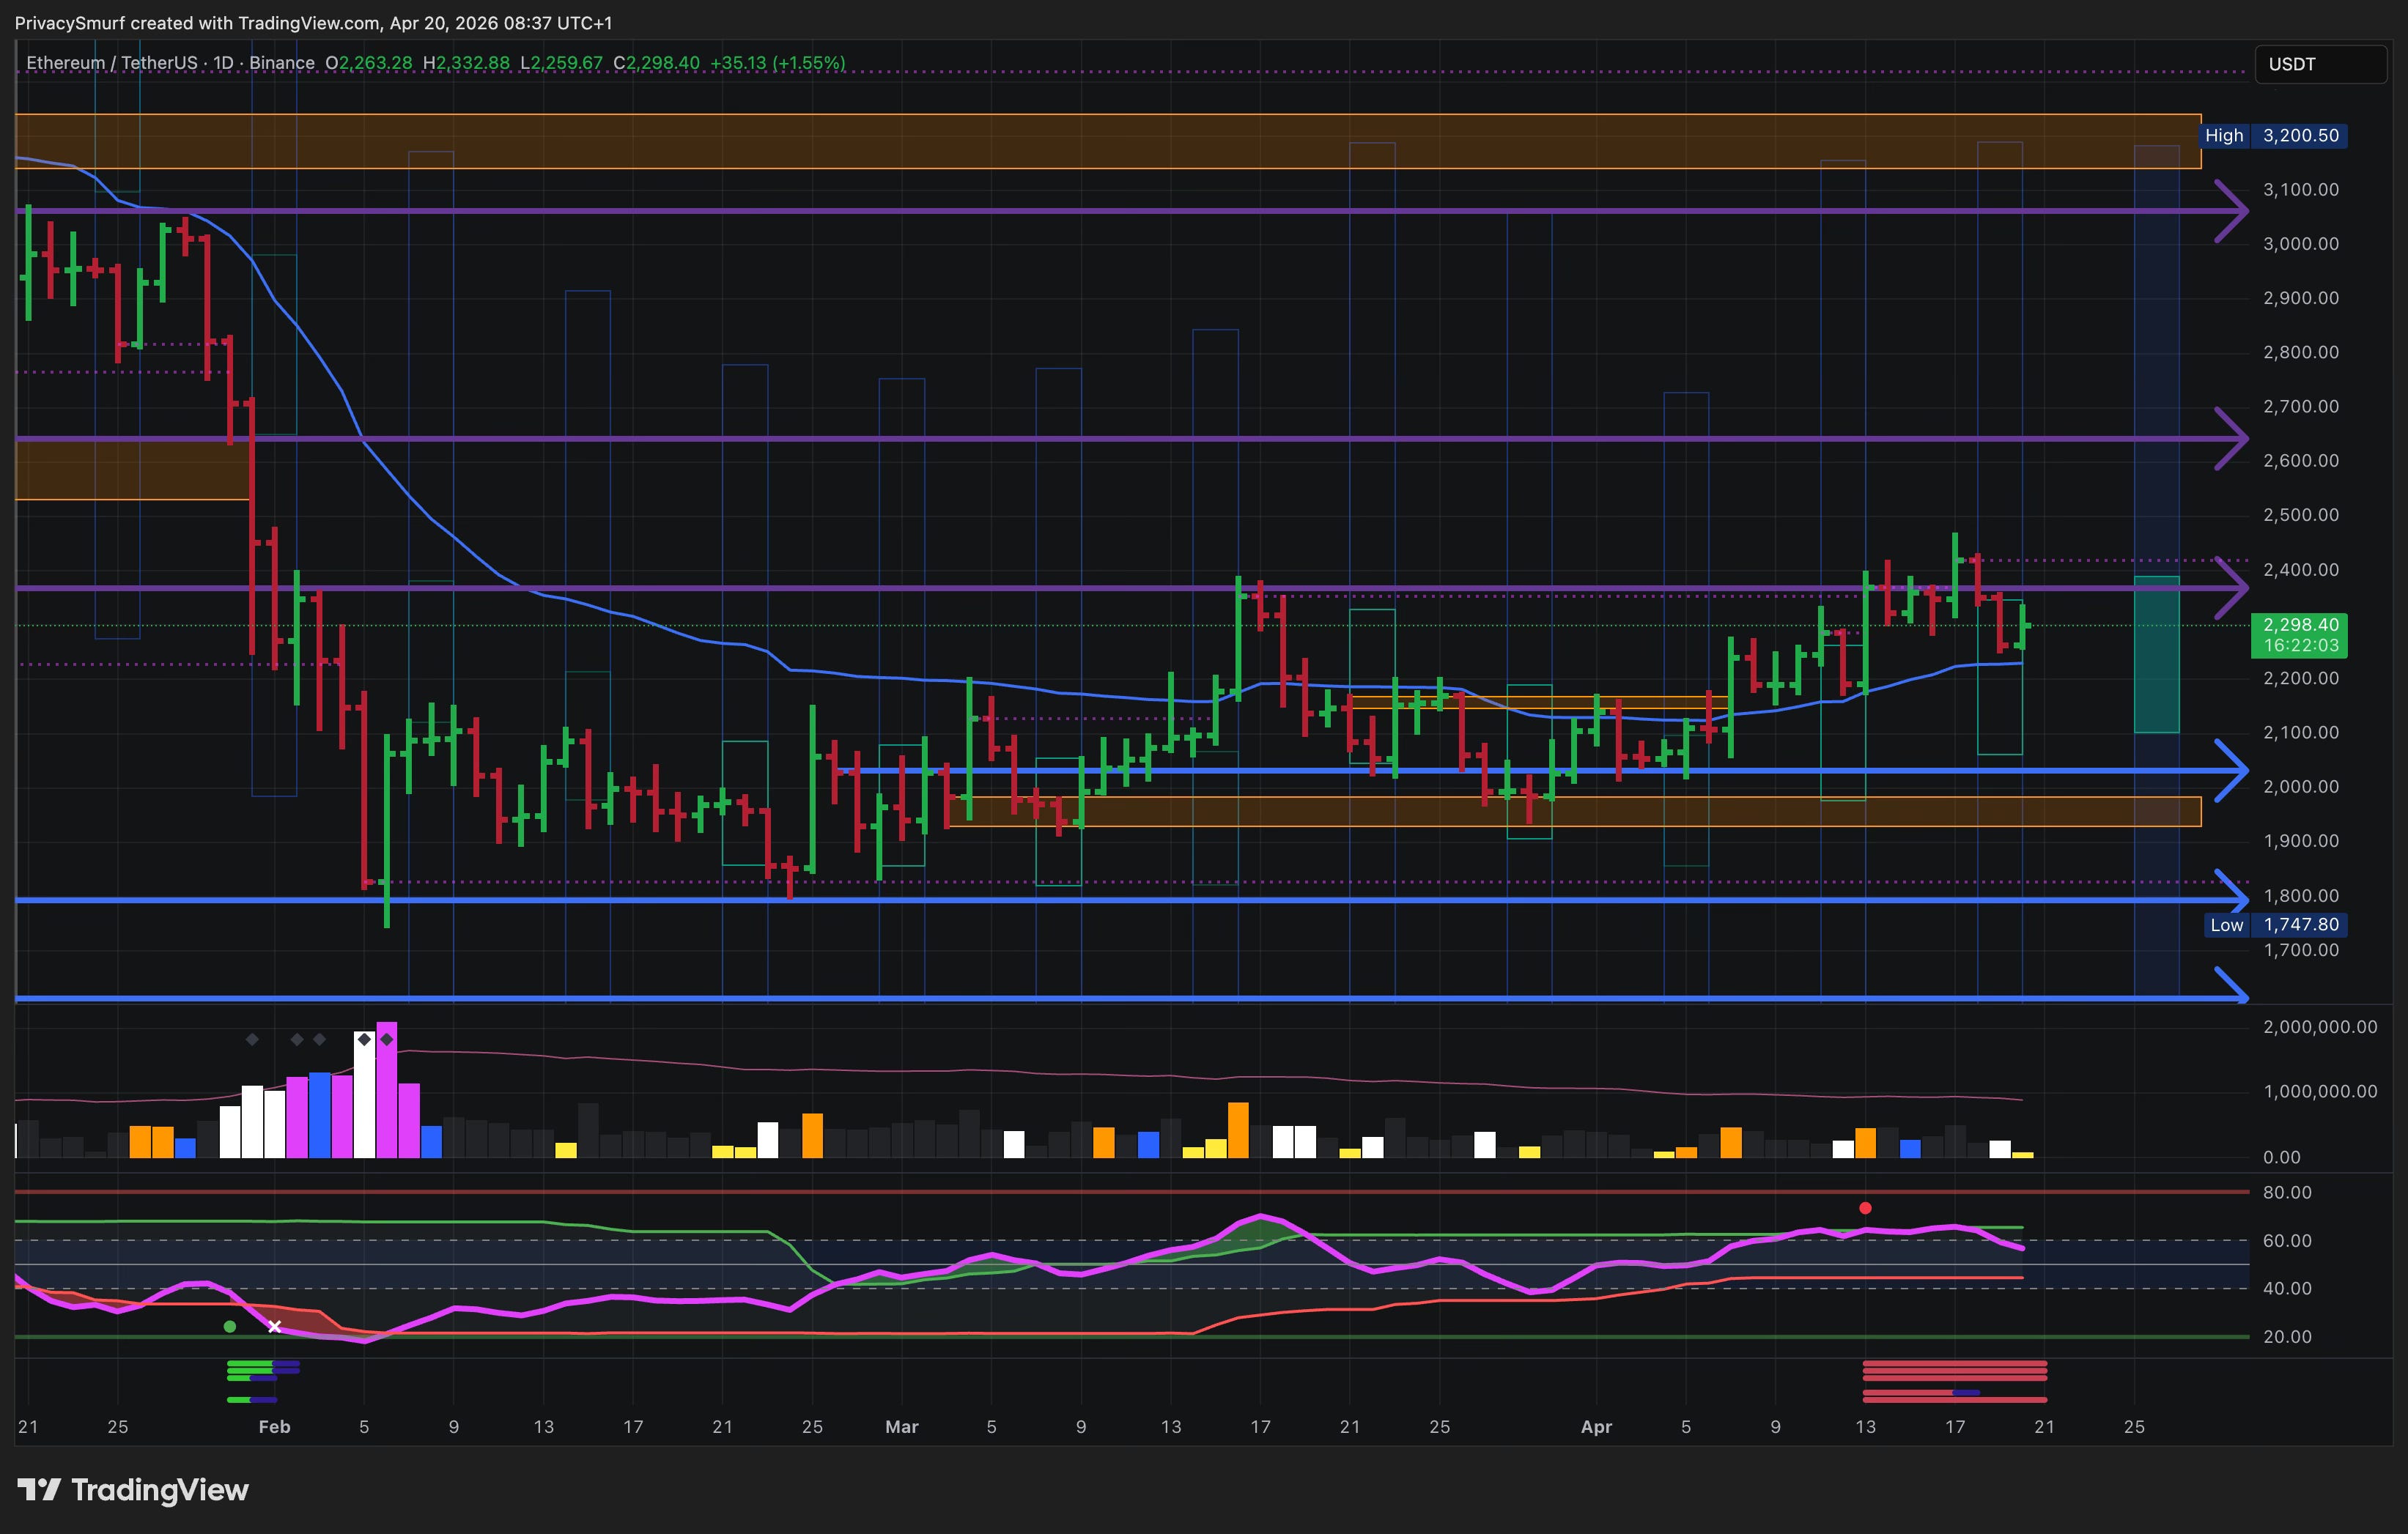
Weekly Closing Direction: Bearish (14 of 26 efficiency — 53.8% efficiency)
Weekly Closing Price Range: $1905–$2190 (34 of 68 — 50% efficiency)
Price Action: Neutral Consolidation
Key Levels:
Resistance: $2370.
Support: $2030
RSI:
Above midline — momentum provides bullish influence on price
Closed back below the adaptive top band — impulsive bullish phase over Break outt ceiling established at $2420
Watch for the bottom band break, which signals the start of an impulsive bearish phase.
Divergence Signals: None at the moment, but a bearish setup has appeared on multiple oscillators, pending trigger.
Past Divergence Trades:

4. Crypto Money Flow
Anchor Point: April 17, 2026 01:20 UTC.
Moved forward a month since the last change. Anchoring from start of market retracement.
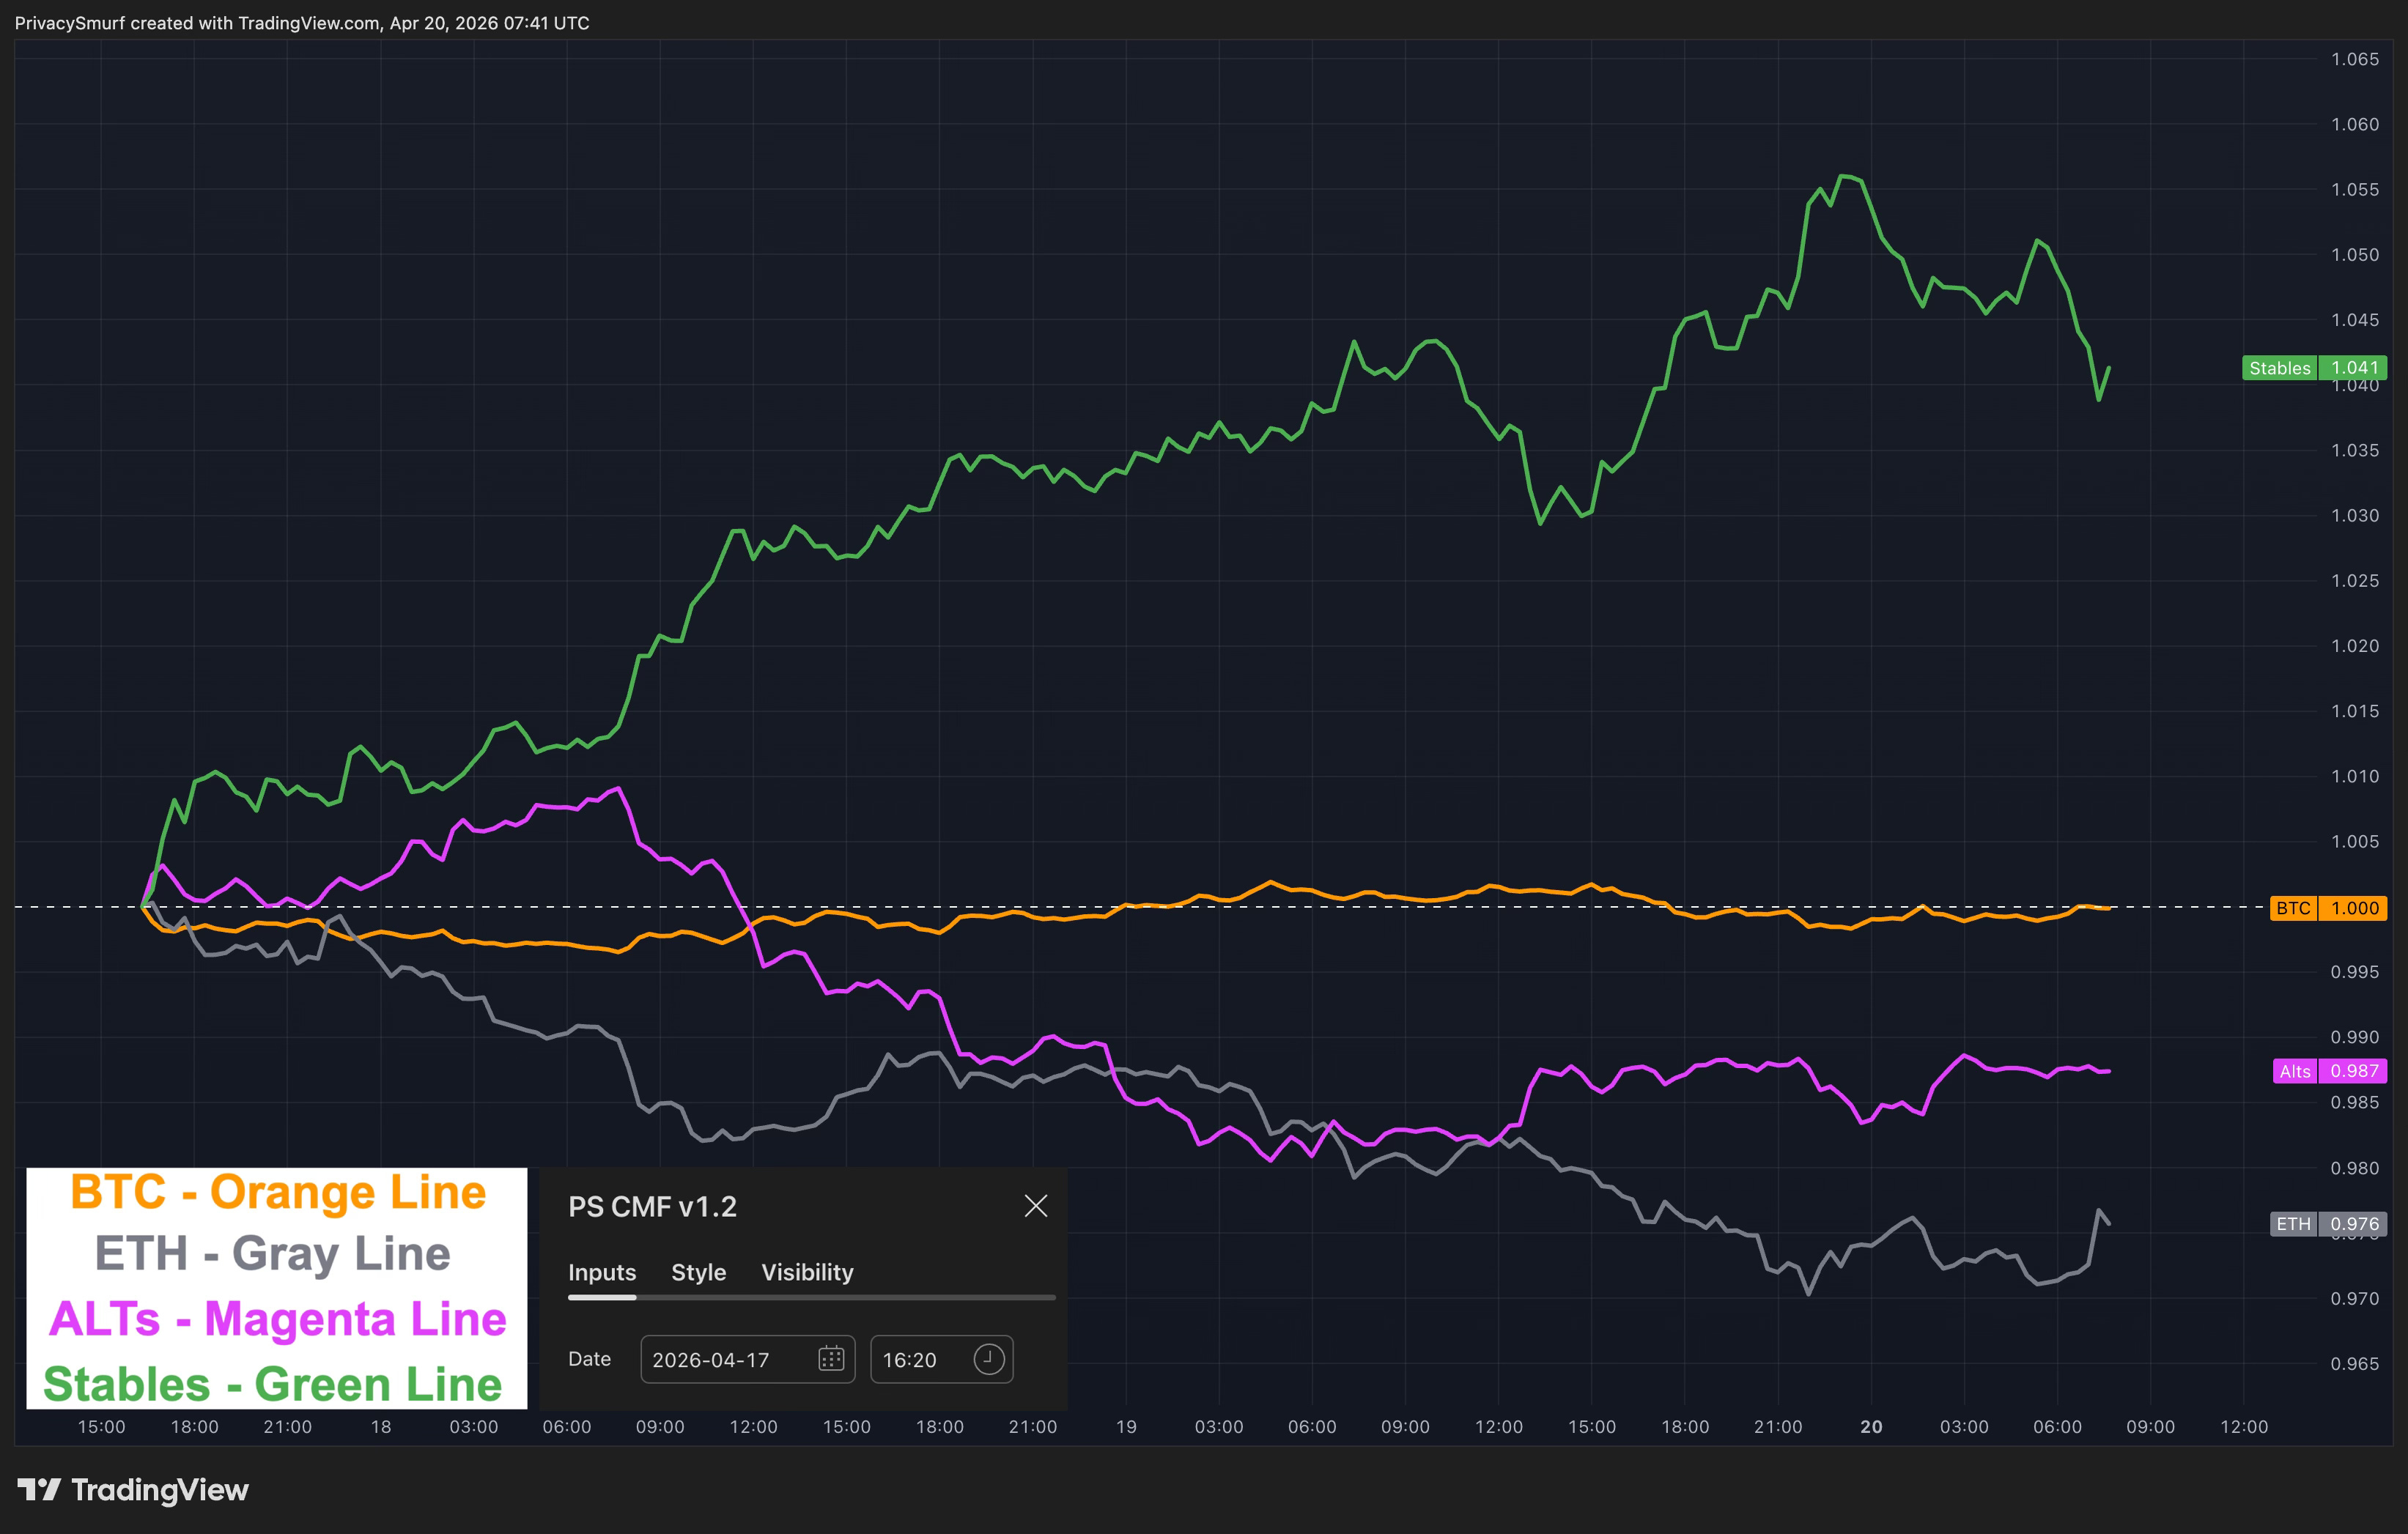
Observation: Stables dominate exposure since the price peak on the 17th.
Interpretation: Consistent with a complete market exit to safety. Troubling sign for the near-term future.
Watching for:
Stables to peak and decline while
BTC bottoms and rallies
Ideally, ETH and ALTs rally as well but less than BTC, signifying the market bottom.
Until those conditions are met, bullish positioning is high risk. The signs last week suggesting a false breakout proved correct. Time to wait for the market to regain a risk appetite.
Reference guides for new subscribers:
@ThePrivacySmurf